An Exploration of Dhaka Air Quality
Overview
Dhaka, the capital city of Bangladesh, is one of the most densely populated cities in the world, with an estimated 29,000 people per square kilometre (to London's 5,700 for example).
Anyone who has lived in Dhaka, like myself (I have been living here since mid-2017), knows that this presents a number of challenges, not least traffic congestion(!)
and air pollution.
It is common to see Bangladeshi newspapers report headlines akin to 'Dhaka air quality ranks worst in the world yesterday'
1, but these only reflect single snapshots in time. I wanted to know
what the air quality data shows over long periods of time. How does it vary with time of day and what are the seasonal variations?
The US Embassy in Dhaka installed an air quality monitor on their roof in 2016 and has a publicly available data archive of hourly reported small particulate matter
air quality measurements since then. An analysis of the data to Feb. 2020 and insights gathered was published as an opinion piece in the Bangladeshi newspaper
The air quality monitor measures the average concentration of fine particle pollutants (PM2.5) in the air over an hour and converts this into an Air Quality Index (AQI) value.
AQI is a numerical scale, between 0 and 500, informing how potentially dangerous the air is to health, where small numbers are good and large numbers are bad.
The recognised acceptable standard for AQI is up to 100, once the quality of air degrades to an AQI above 100, sensitive groups of people may experience adverse health effects.
AQI values above 150 are considered "unhealthy", meaning everyone begins to be at risk of adverse health issues, the severity of which increases as the AQI gets larger
-- with air deemed "very unhealthy" at AQI in excess of 200 and "extremely unhealthy" above 300.
The chart below shows these air quality data, with the mean daily AQI given by the data points and mean monthly AQI values given by the black line.
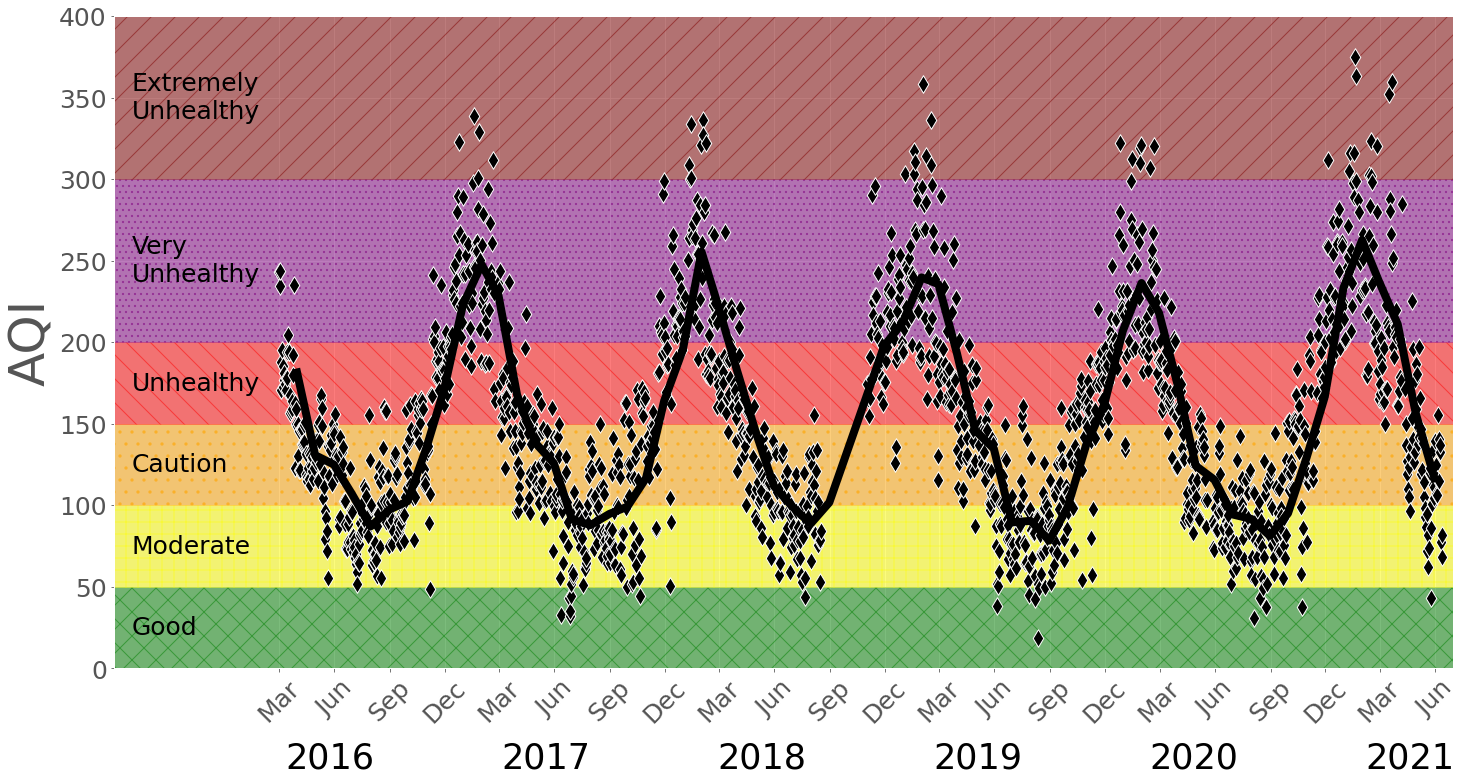
Two things are immediately obvious from the graph;
(1) Dhaka air is rarely below the safe AQI standard of less than 100 and
(2) there is clearly seasonal variation.
Seasonal Variations
Taking a closer at the seasonality, by aggregating the data, across all the years, to get the mean monthly AQI values, we see that air quality is much worse during the winter months and at its best during the monsoon season from June to September.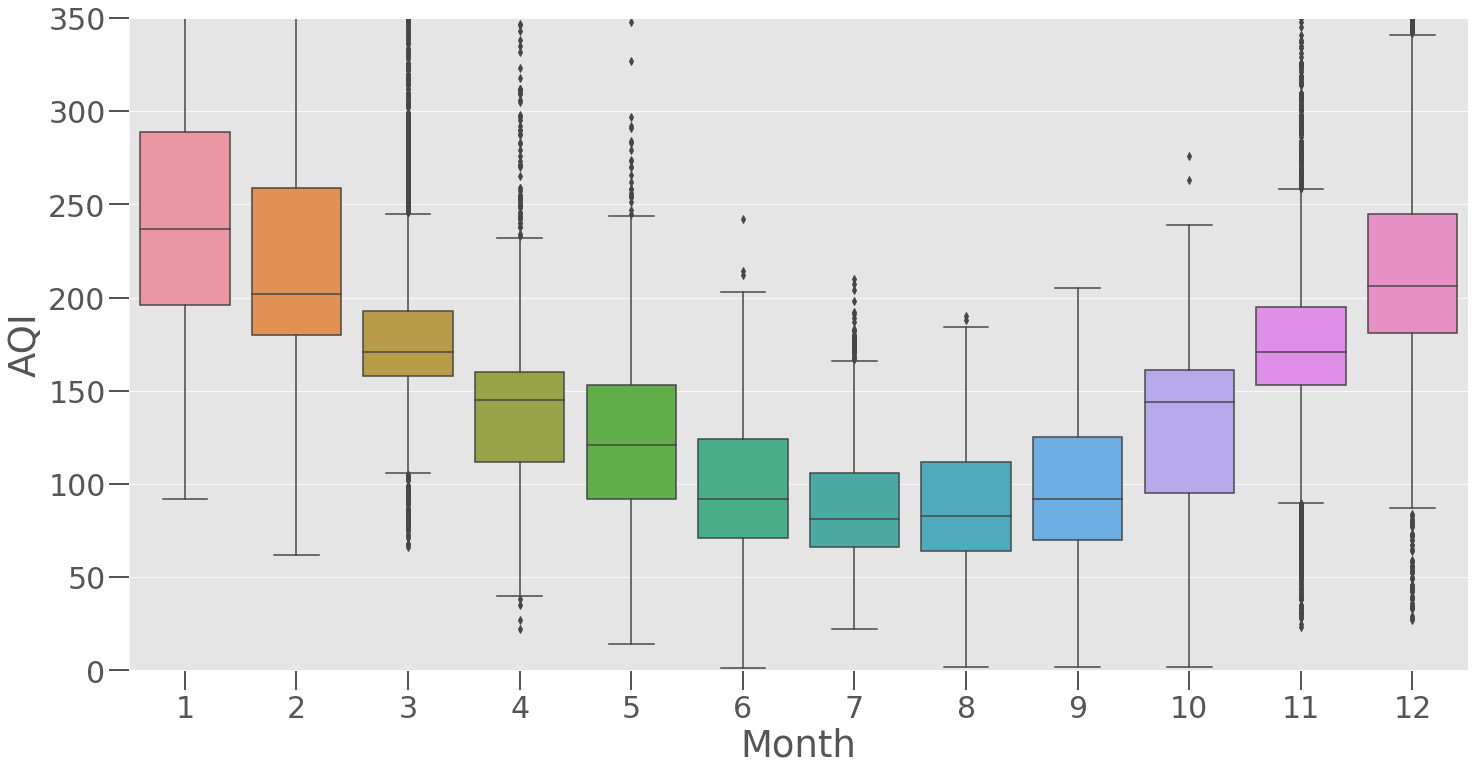
But why is this the case? During winter in Bangladesh, an unfortunate combination of meteorological, geographical and human factors work in tandem to create and keep high levels of pollutants in the air. Firstly, highly polluting industries like brick manufacturing (a Department of Environment study in 2014 attributed 58 percent of Dhaka's air pollution to brick kilns) and construction work are substantially increased in winter to offset lost productivity during the wet season. This then combines with a meteorological phenomenon called "temperature inversion", in which colder winter air, which you may recall from physics classes is more dense (since hot air expands), gets trapped under a layer of warmer air in the atmosphere. This blanket of warmer air prevents polluted air at ground level from mixing with clean air at higher altitudes and dispersing pollutants away. So, we have a situation where there is a higher production of pollutants and a weakened mechanism to carry them away.
Relief eventually comes as temperatures rise for summer, since the warmer air mixes with the higher atmosphere and is more effective in dispersing pollutants. Additionally, as the monsoon rains begin in earnest, the rains washout pollutants from the air and many pollutants-creating industries and construction work scale back.
Hourly Variations
As the data has an hourly resolution we can explore whether air quality varies with time of day. A more precise analysis should take into account the varying timelight hours throughout the seaons, but as Bangladesh is in the tropics, the daylength varies by less than three hours between peak winter and summer, so we can ignore that for a simpler exploration.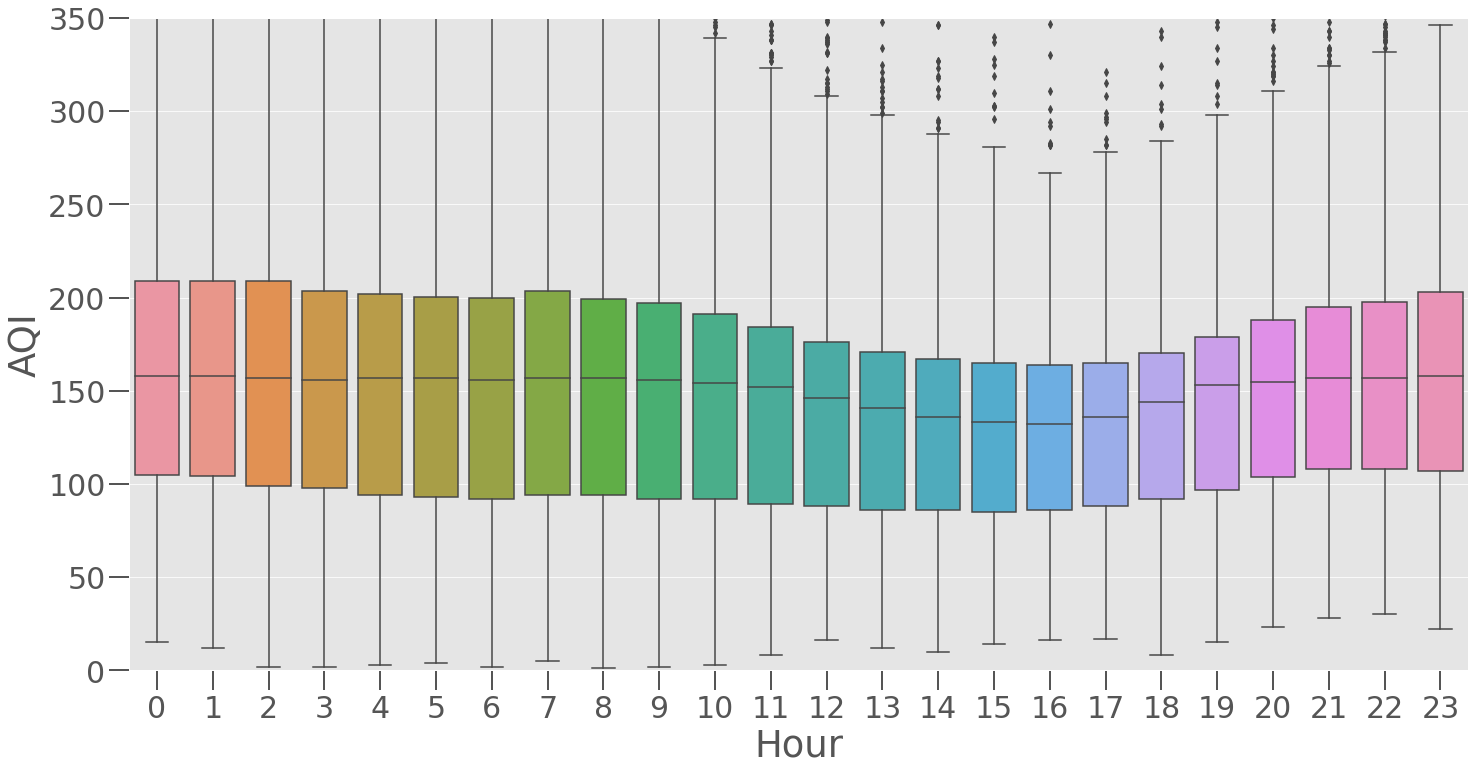
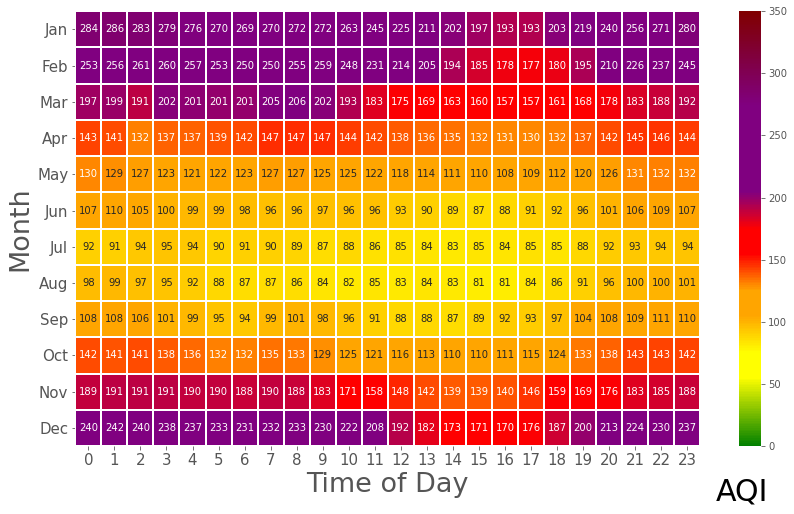
It turns out the air quality is at its worst during the night and early morning. Despite the increased number of cars on the road at this time, the hours with the best air quality are generally 10AM to 8PM. What is going on? Well, remember the temperature inversion, where cooler air doesn't mix as well with the upper atmosphere? The same thing happens during the night. So counterintuitively, despite more pollutants being produced during the day, there is less pollution because the hotter daytime air rises and mixes with cleaner air at higher altitudes, dispersing these pollutants more effectively.
Combining the aggregation by month and hour lets us produce a heatmap, showing a breakdown of the average AQI for each hour of the day for each month - which factors in seasonal variations in daylength.
Unfortunately, we have little individual control over the air around us. However, there are certain small measures you can employ to mitigate the adverse effects to your personal health. Avoid vigorous exercise outdoors during the night and morning hours when air quality is worse. If you are fortunate enough to be able to afford one, a good quality face mask can protect you while outside (unfortunately a scarf or a cheap surgical mask does little to filter out these harmful fine PM2.5 pollutants). When indoors, close the windows and use an air purifier, especially during winter nights when the air quality is at its worst.
Expansion
I plan to expand this analysis with additional locations as I have discovered that the Bangladesh government records air quality in a number of locations across the country. Unfortunately, they do not publish this data in an easily accessible file, I have built a web scraper to extract this data (see here for an example of how this data is stored).Coming soon! An interative web data dashboard.
Resources
The GitHub repo for this project can be found here: A link to the Daily Star article can be found here: