Covid-19 in Bangladesh

Informative visualisations of data of the spread of Covid-19 in Bangladesh are hard to find. So I have built my own.

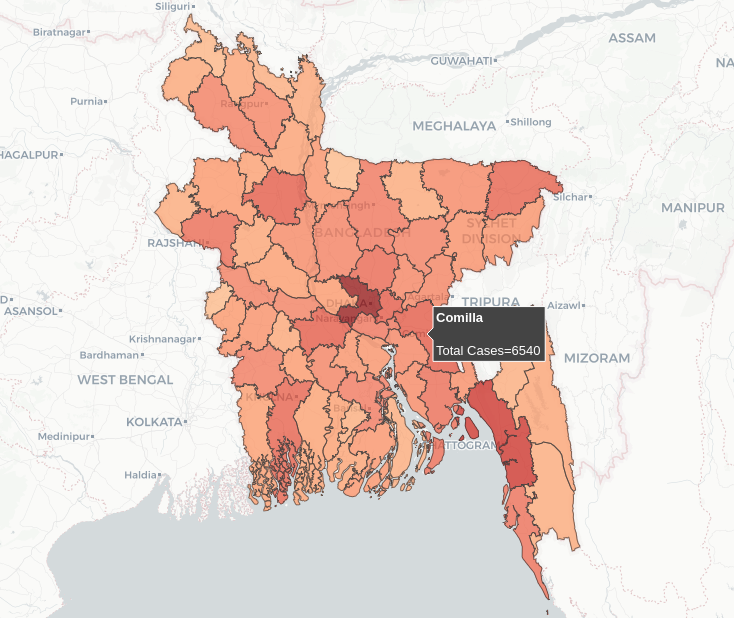
This project includes an app deployed online containing interactive visualisations of geospatial data and time-series analysis of national data.

Learn more about this project:

Overview

I have built a web-app allowing interactive visualisations, including the daily national data, cumulative national data and regional data. The app can be loaded here. The app was developed using Dash in Python, which uses the Plotly visualisation package. The app is deployed on a free-tier Heroku account so may take some time to initially load (as the site goes to sleep when inactive), so please be patient!

The GitHub repo for this project can be found here:

Find me on ...